Google Charts - Pie chart
When you develop a PHP web site for an organization or for a specific requirement, you will need to keep a track of reports. So Google Charts will help you to elaborate the graphical representations in order to get a more clear report .
Following example will clearly show you the way of creating a pie chart using google charts.
Following example will clearly show you the way of creating a pie chart using google charts.
Now the data should be added to database table as below.
Then search Google charts for pie charts from your web browser. From here by using the given codes you can create either a pie charts or a Donut chart.
Now what you have to do is simply copy the given code in to your text editor and edit the necessary parts to create your pie charts.
Now add the sql query with the database connection to select the data in the table.
Above image will show you the changes I have made to get the pie chart according to above example.
In the head you will have to write the database connection and the sql query to select the data from the created table in your database.
Then you will have to name the labels and get the each row data from the table as follows
Also change the title in the given space and save the file.
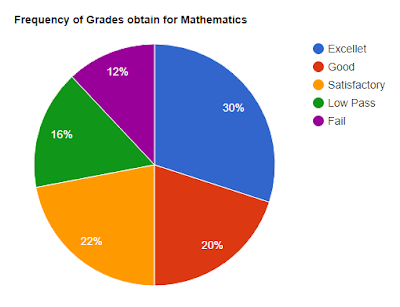
Now run your file and get the output as below.
Hope you got to know the way of creating a pie chart using dynamic data through this basic example. You can use this method to create pie chart representations for your reports in web projects.


Comments
Post a Comment